A successful agency partnership runs on clarity about what’s being delivered and what it costs. Scope Optimizer turns scattered SOWs, change orders, and production estimates into a connected view of your portfolio, so you can see scope coverage, spot duplication, and free up budget that’s currently invisible. Compare your creative roster’s output against your media spend, or check whether last quarter’s changes ever made it back into the master scope.
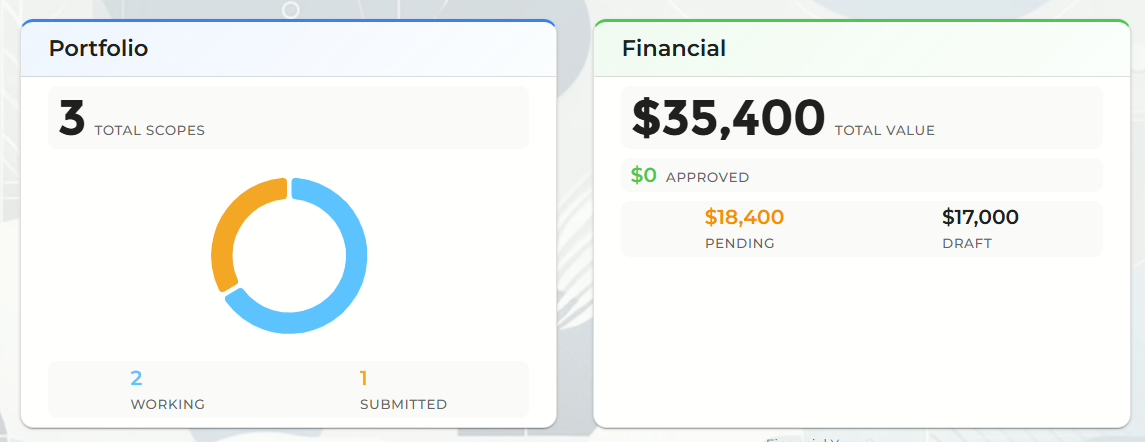
A clear, top-down view of what’s actually being scoped, across every agency in your portfolio.
⚙️ Creative, Production & Media analytics
⚙️ Scope coverage & overages
⚙️ Cross-portfolio duplication & gaps
⚙️ Year-on-year scope trends
AI-generated analysis that turns scope and spend data into the patterns and priorities you’d otherwise miss.
⚙️ Executive summary
⚙️ Scope deviation alerts
⚙️ Covers work, resources & Expenses
⚙️ Action recommendations
Low Friction
Fast to deploy and easy to use
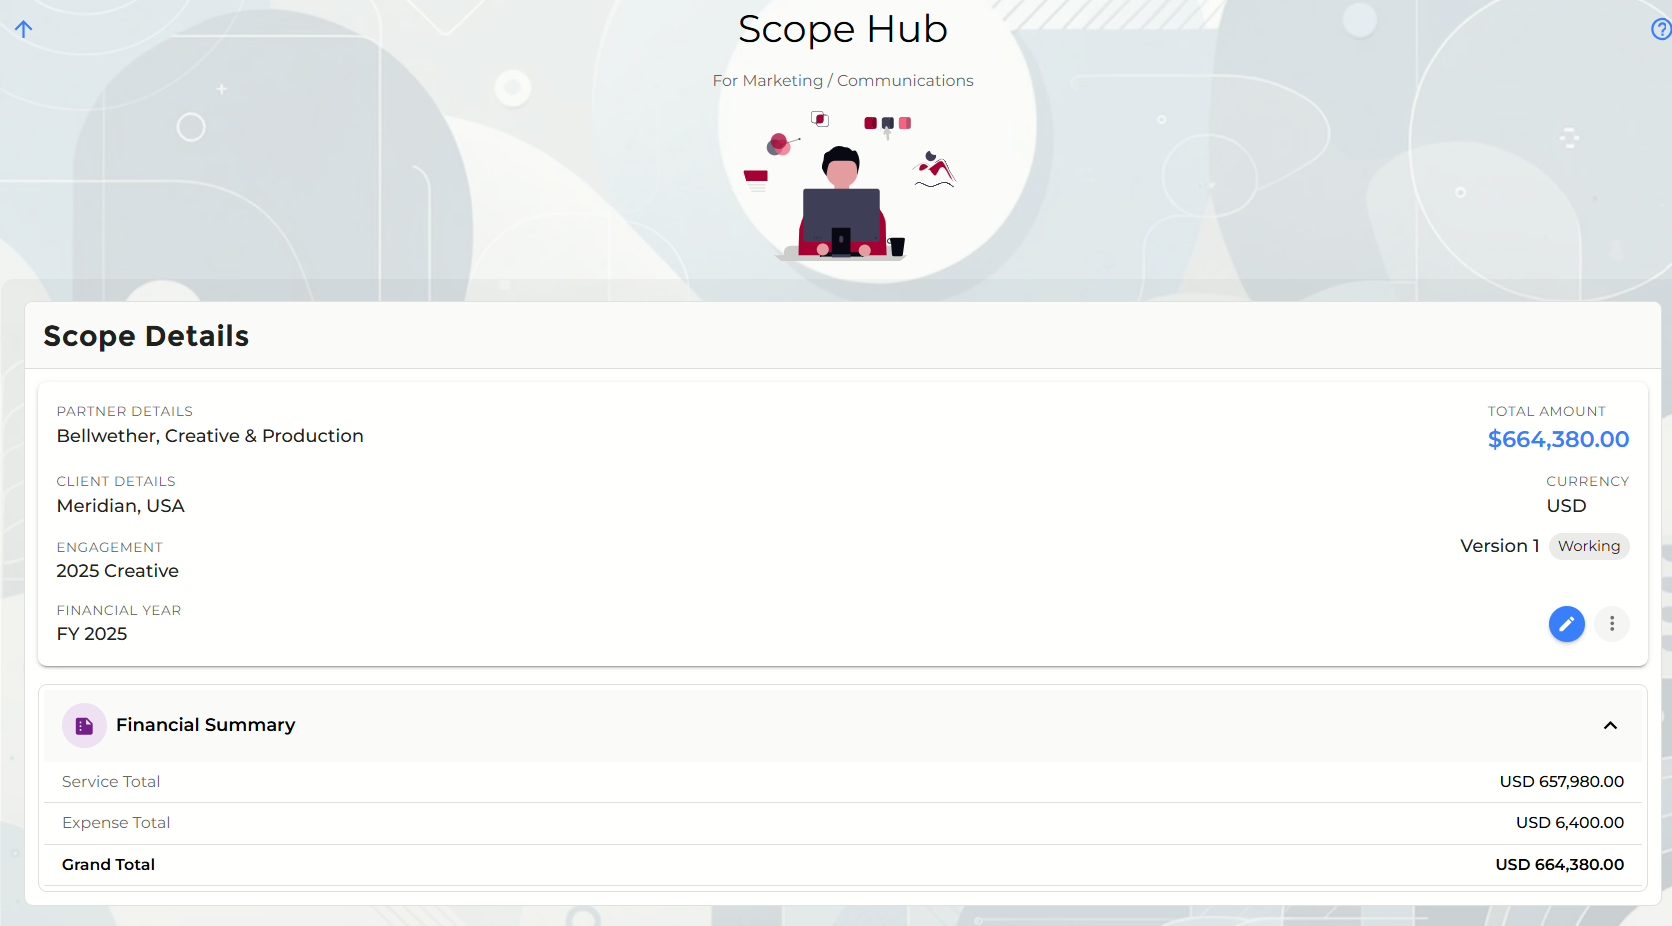
Scope Optimizer is designed to do one thing and do it exceptionally well. We help your team build, capture, and approve scopes of work in days instead of weeks, with structure baked in from the first draft.
Create a complete, structured SOW in minutes, not from a blank document.
⚙️ Build from a standardized deliverable library
⚙️ Build a central reposiroty of rsource
⚙️ Clone and adapt from any prior SOW
⚙️ Guided setup wizard
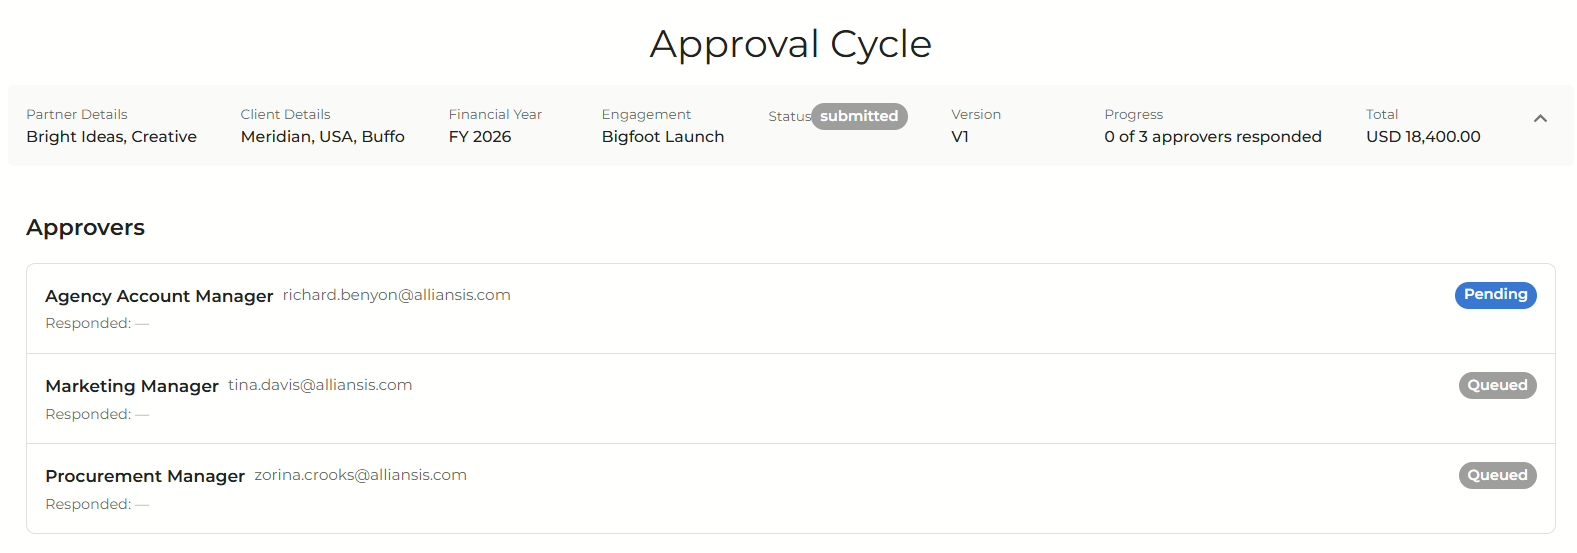
An approval experience that matches how your organization actually works, with full visibility on every change.
⚙️ Configurable approval workflows
⚙️ Automated stakeholder notifications
⚙️ One-click review & approval links
⚙️ Full audit trail on every change
Flexible Set-Up
Configure to suit your organization
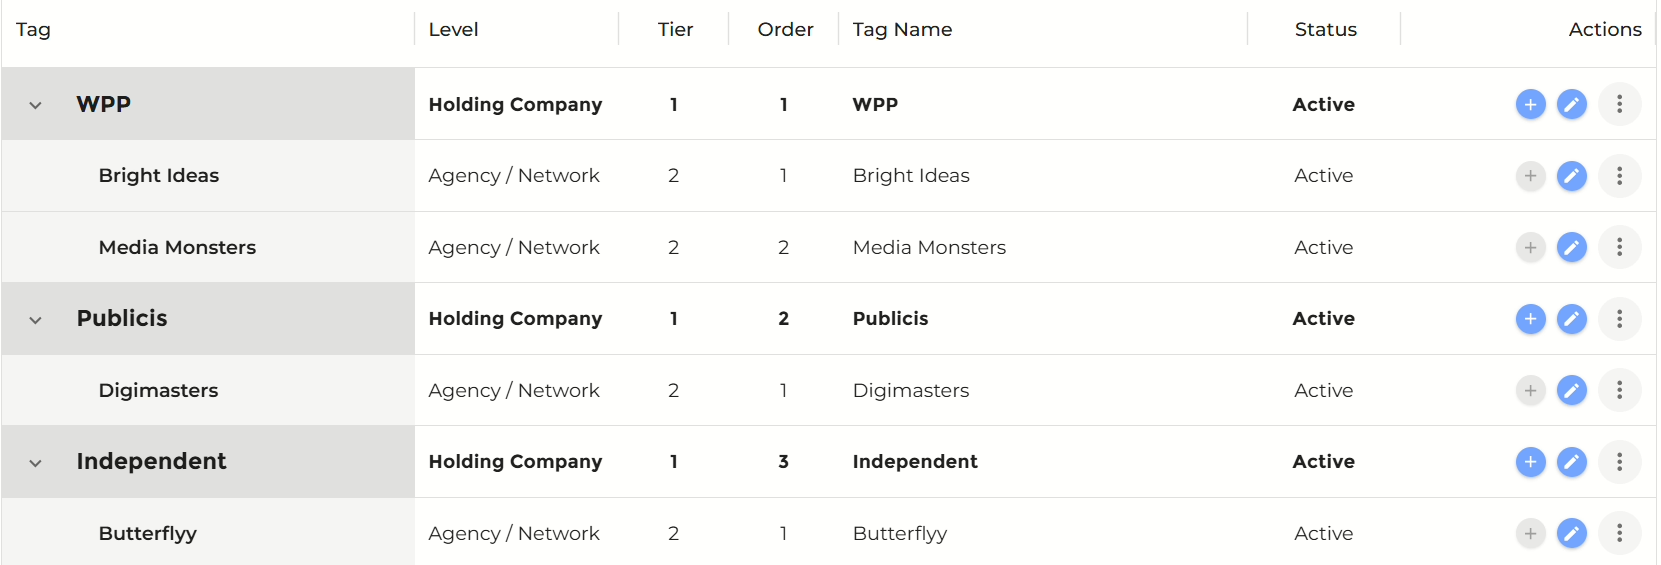
For more advanced requirements, you control the deliverable taxonomy, approval workflow, and reporting structure: by agency, holding company, region, brand, or discipline. It’s the flexibility to have it exactly your way, no compromises!
Customize your scope content to match your organization’s deliverable taxonomy and SOW methodology.
⚙️ Custom deliverable taxonomies
⚙️ Build your own scope templates
⚙️ Complexity tiering (T-shirt sizing)
⚙️ Multi-lingual (18 languages)
Configure reporting to exactly match your company’s commercial structure.
⚙️ Agency, firm, supplier, HoCo
⚙️ Global, region, country, office
⚙️ Business unit, brand, TC
⚙️ Category, sub-category, discipline
Scope Intelligence
Explore, compare and prepare
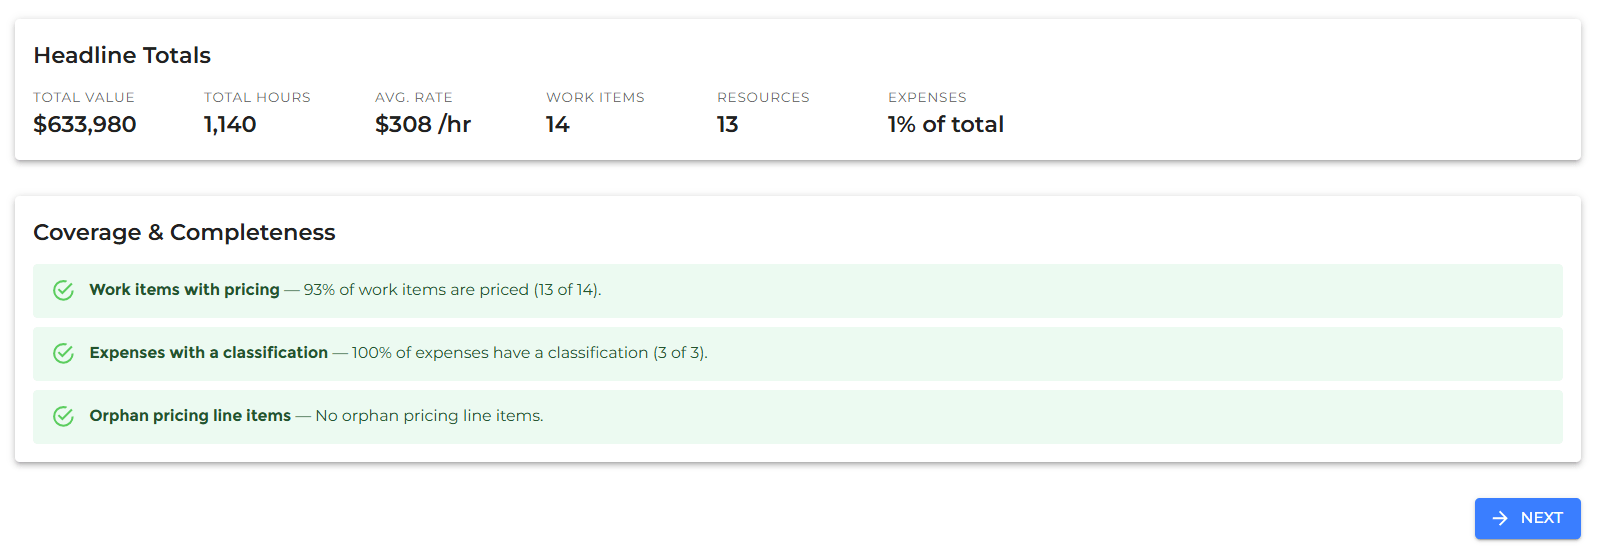
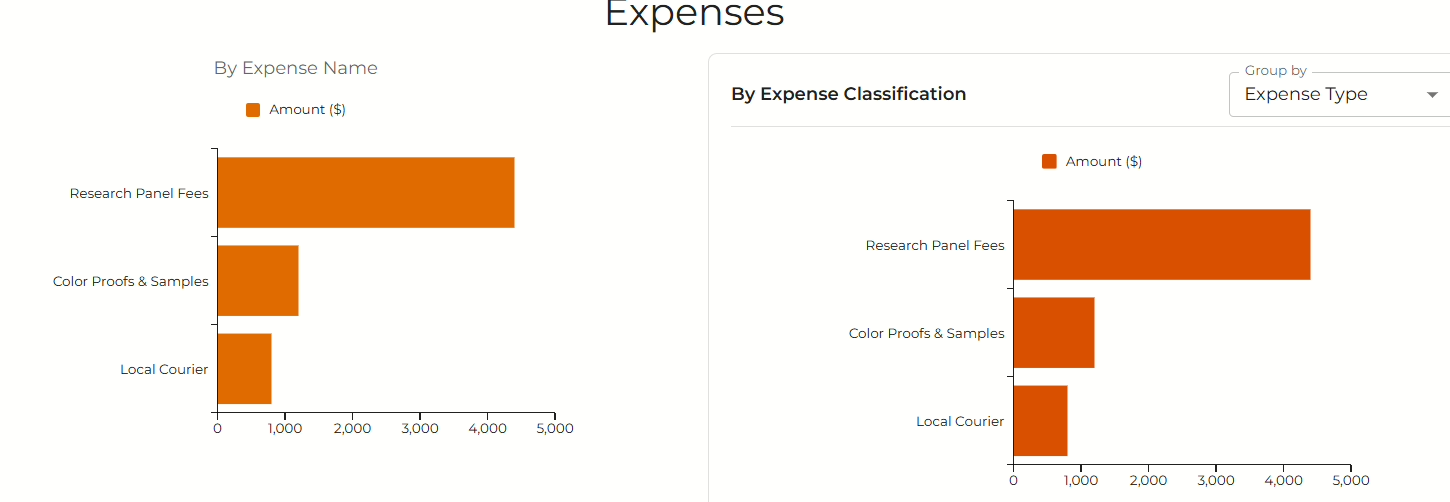
Powerful analytics to explore and compare scopes, spend, and delivery across your portfolio. Reconcile actuals to plan, prep for QBRs and year-end reviews, and walk into every agency conversation with the data already on your side.
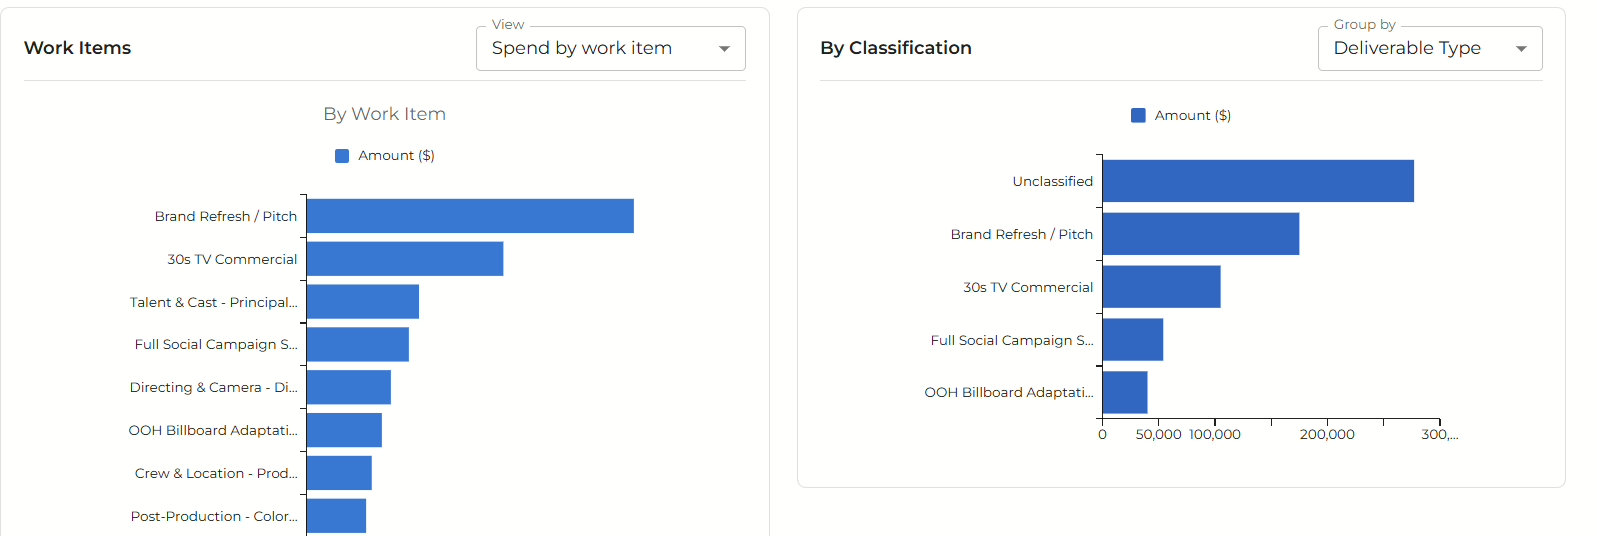
Understand and present your scope and spend data with high-quality visualizations.
⚙️ Gap, benchmark, year-on-year
⚙️ Budget vs. actual waterfall
⚙️ Bar, table, donut, trend
⚙️ 2-dimensional heatmaps
Explore your scope and delivery data your way with powerful reporting.